1 Node Exporter 1.0.1 11,66611,666 2.8 (4 reviews)
11/18/2018
2/14/2021
5
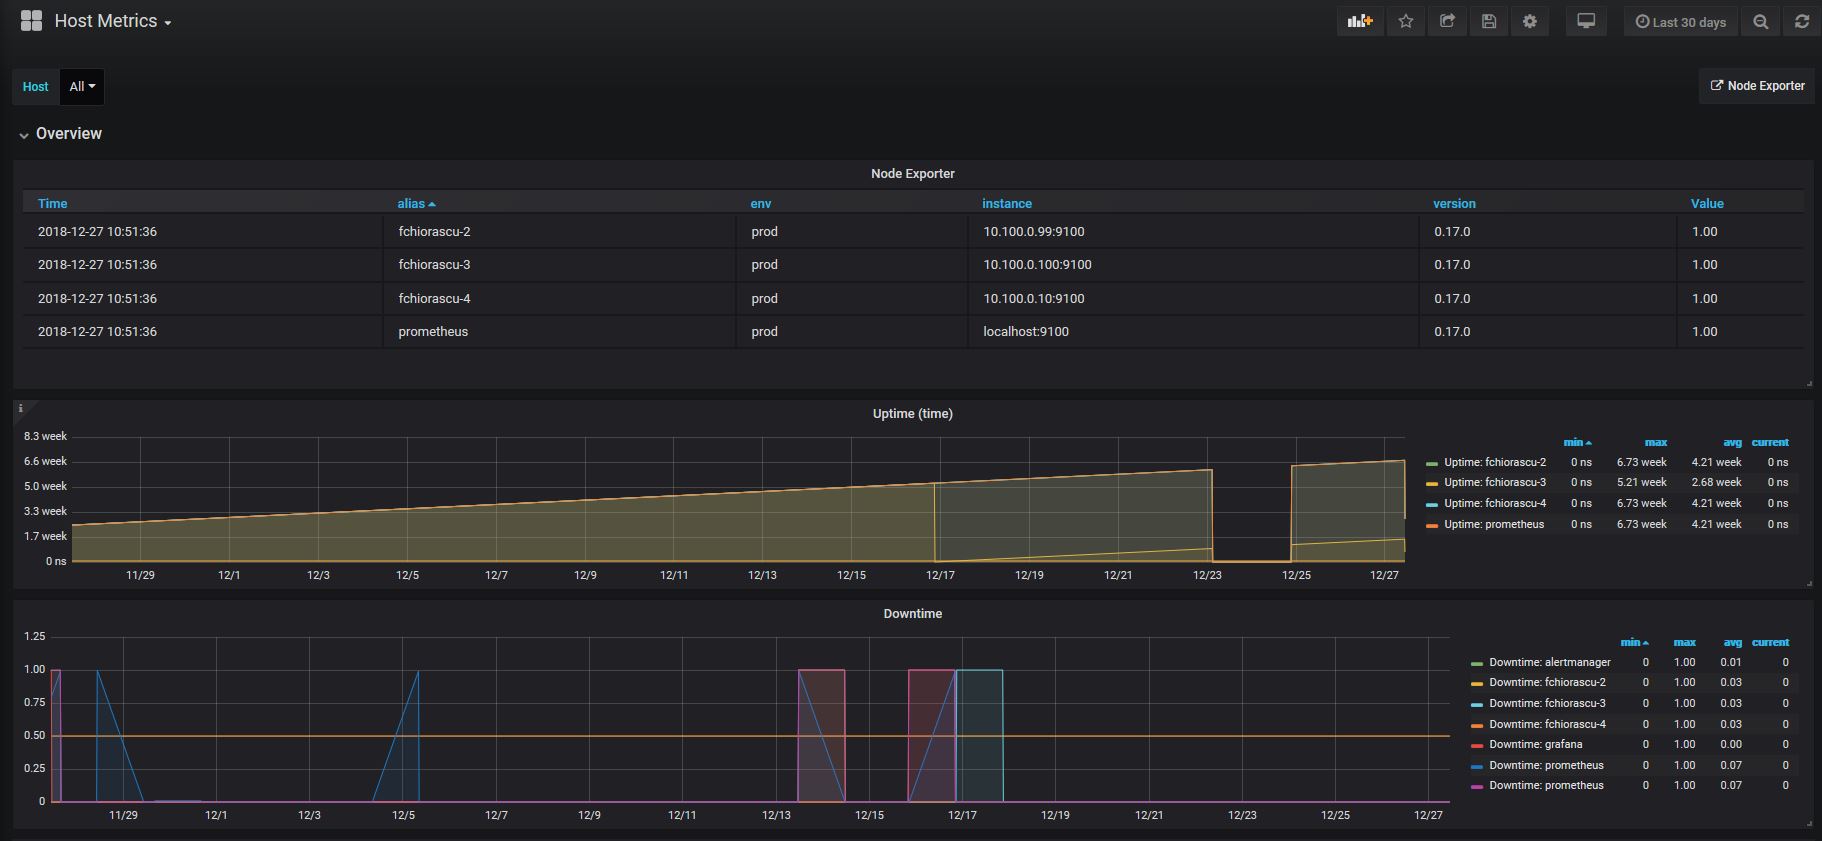
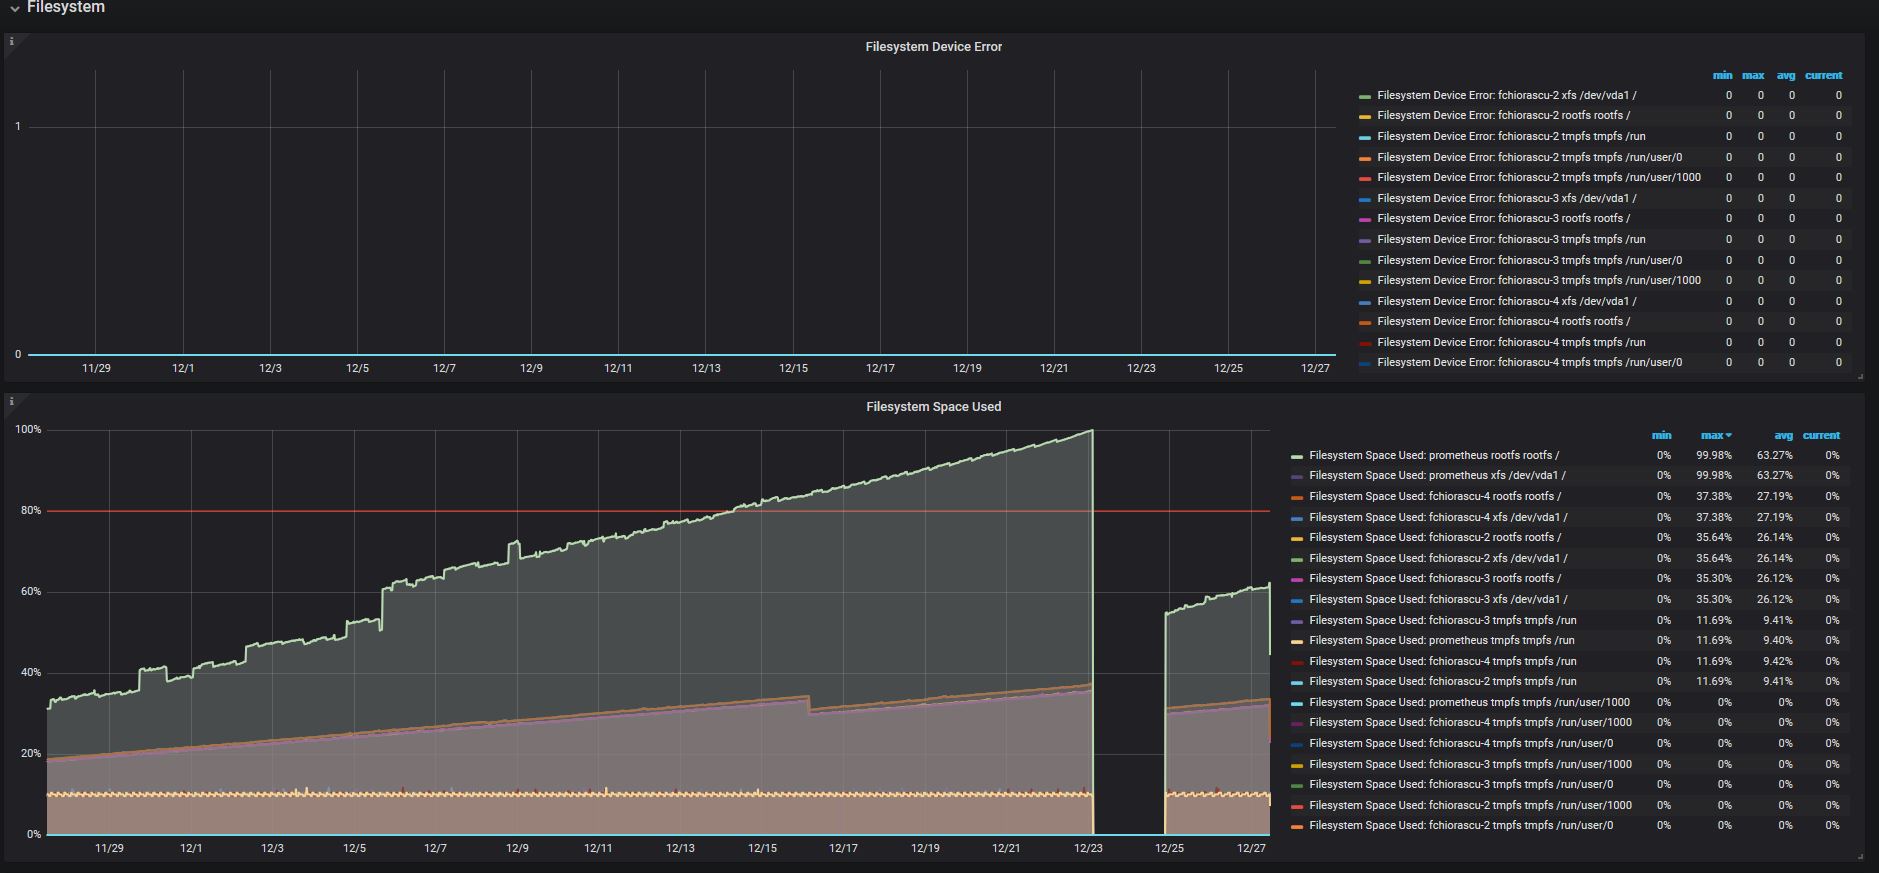
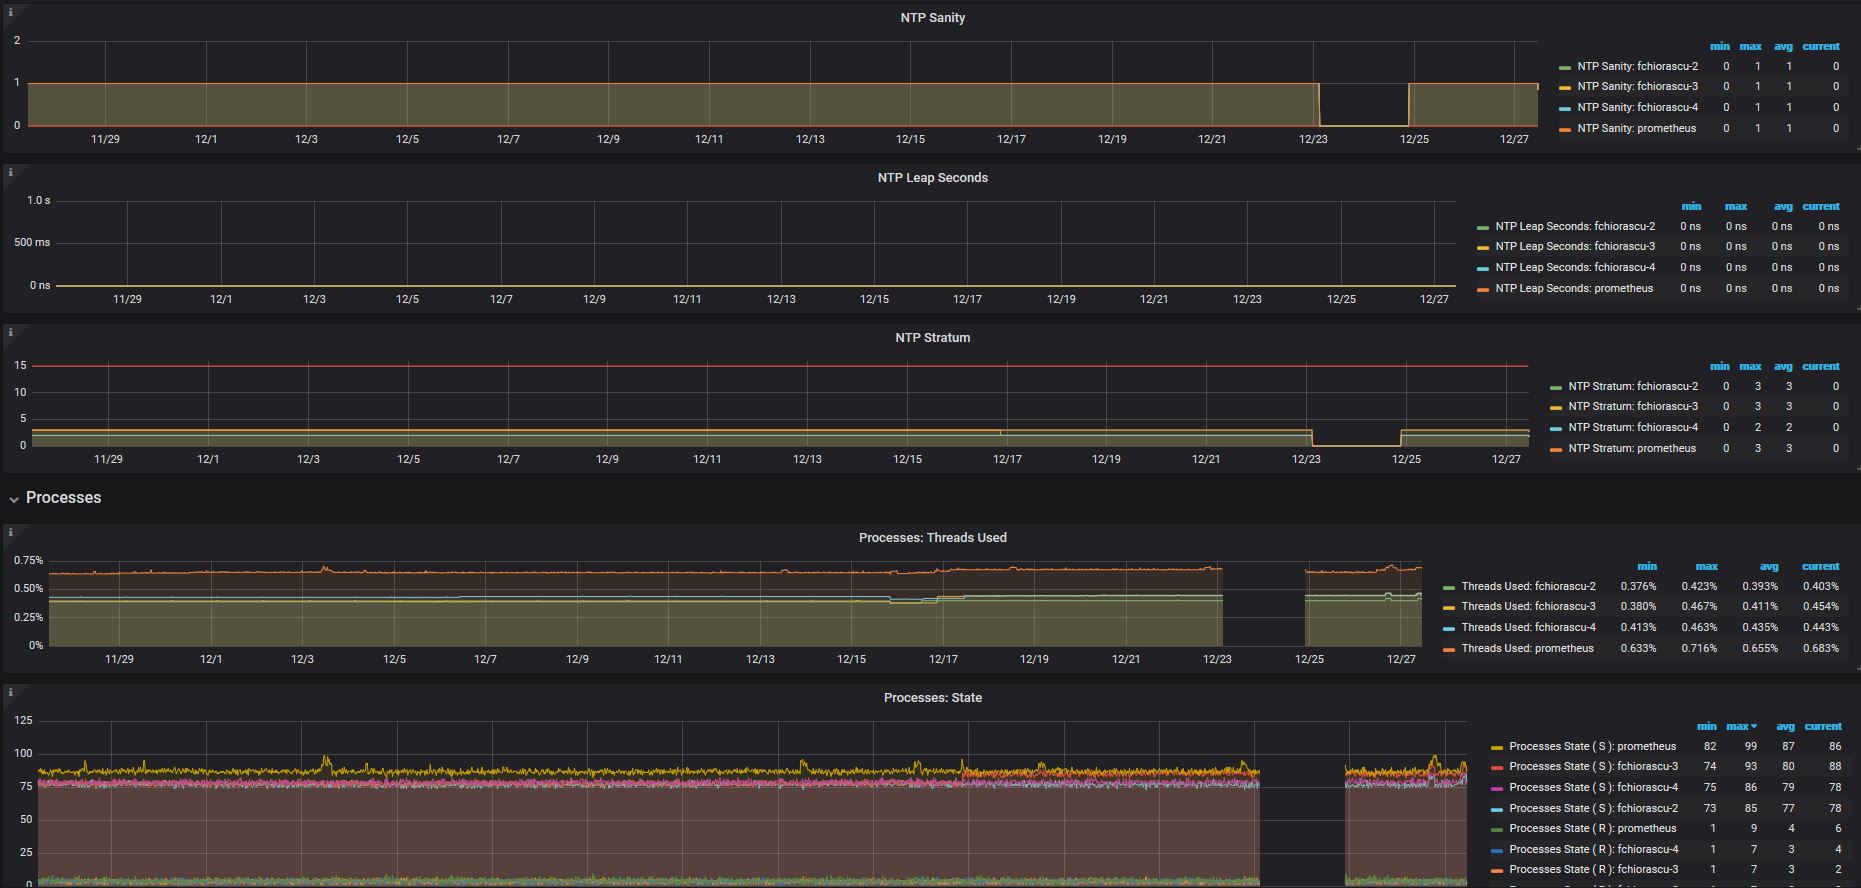
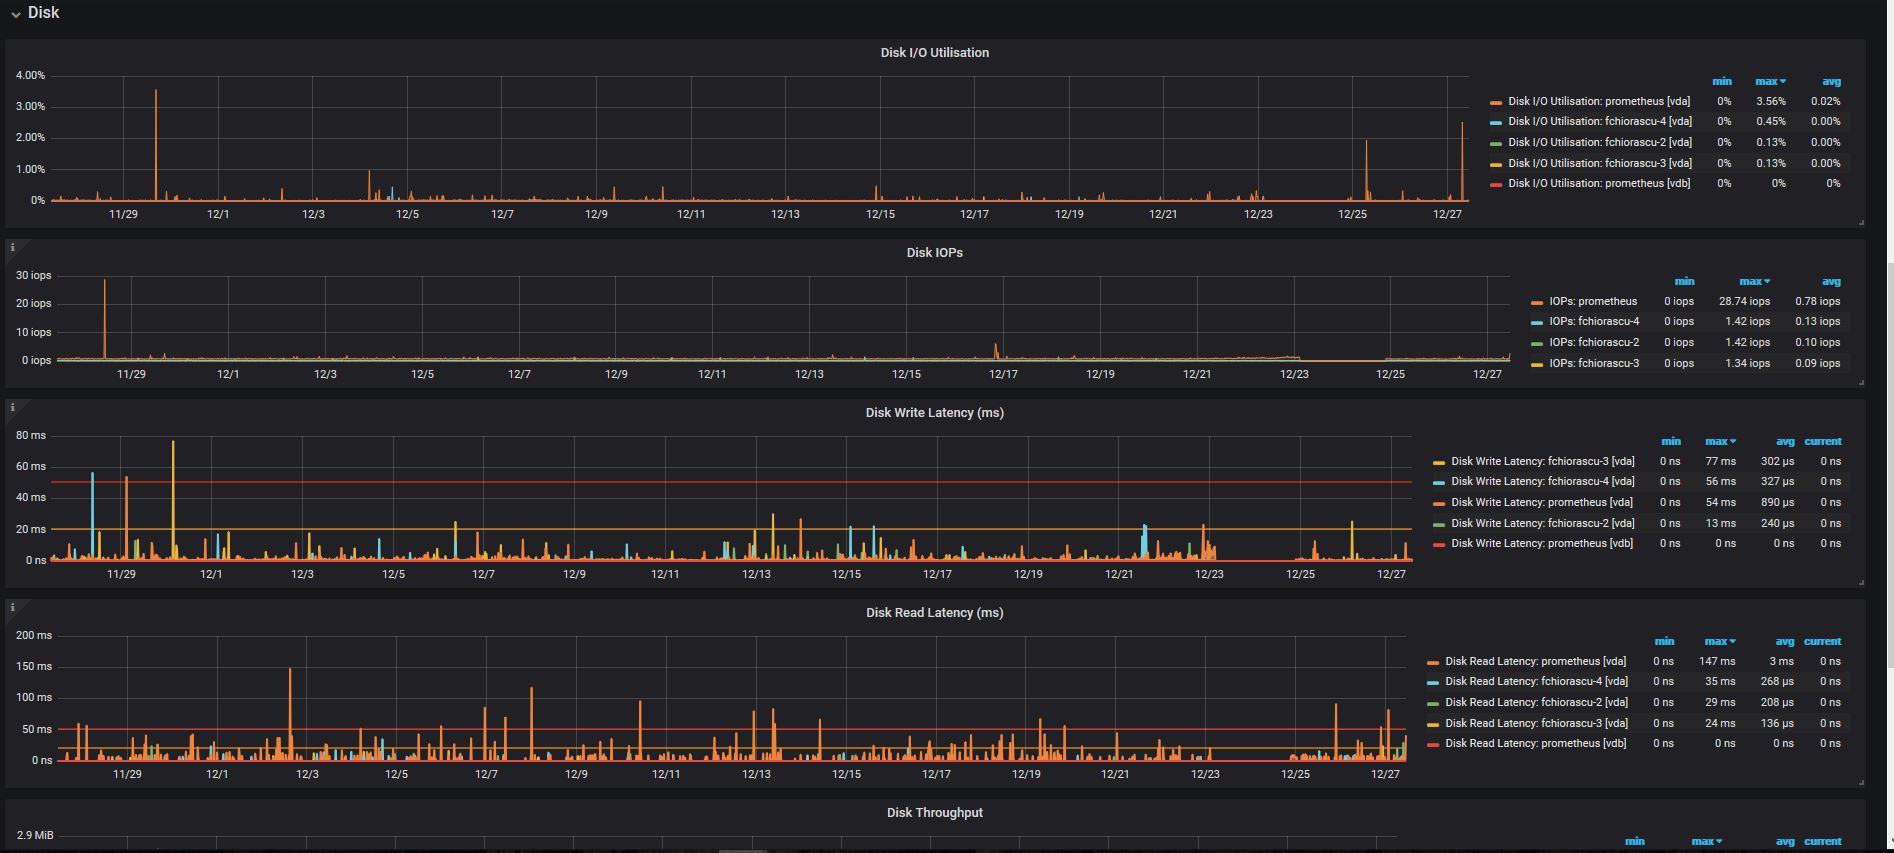
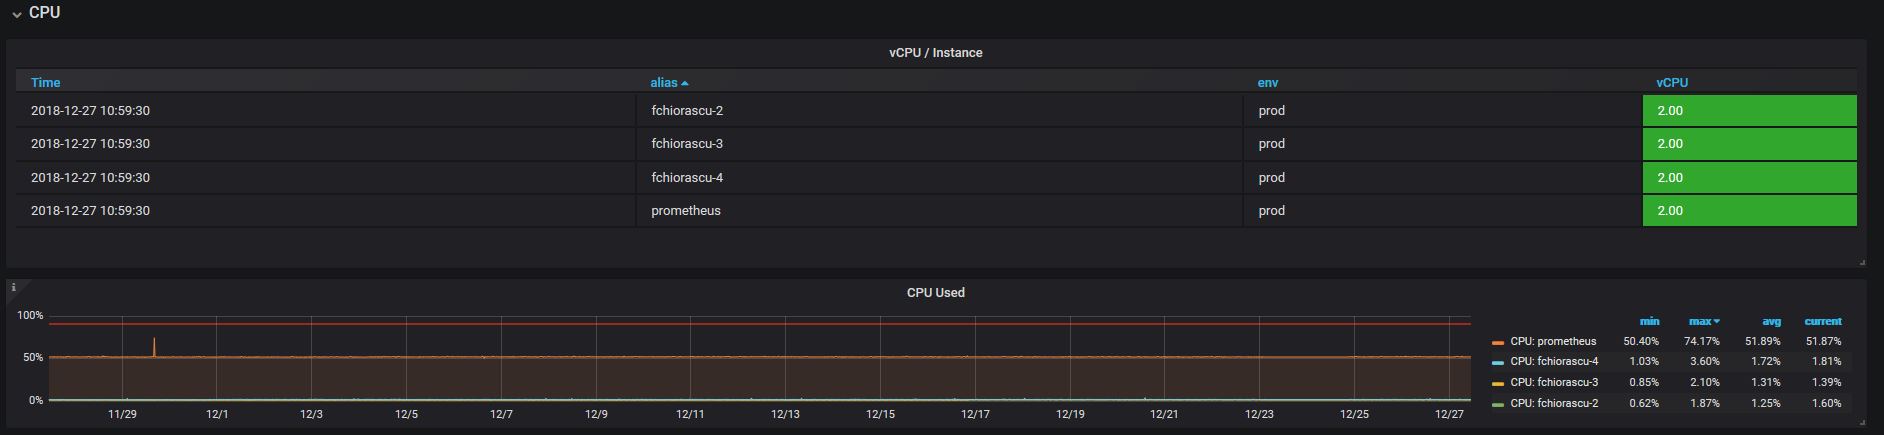
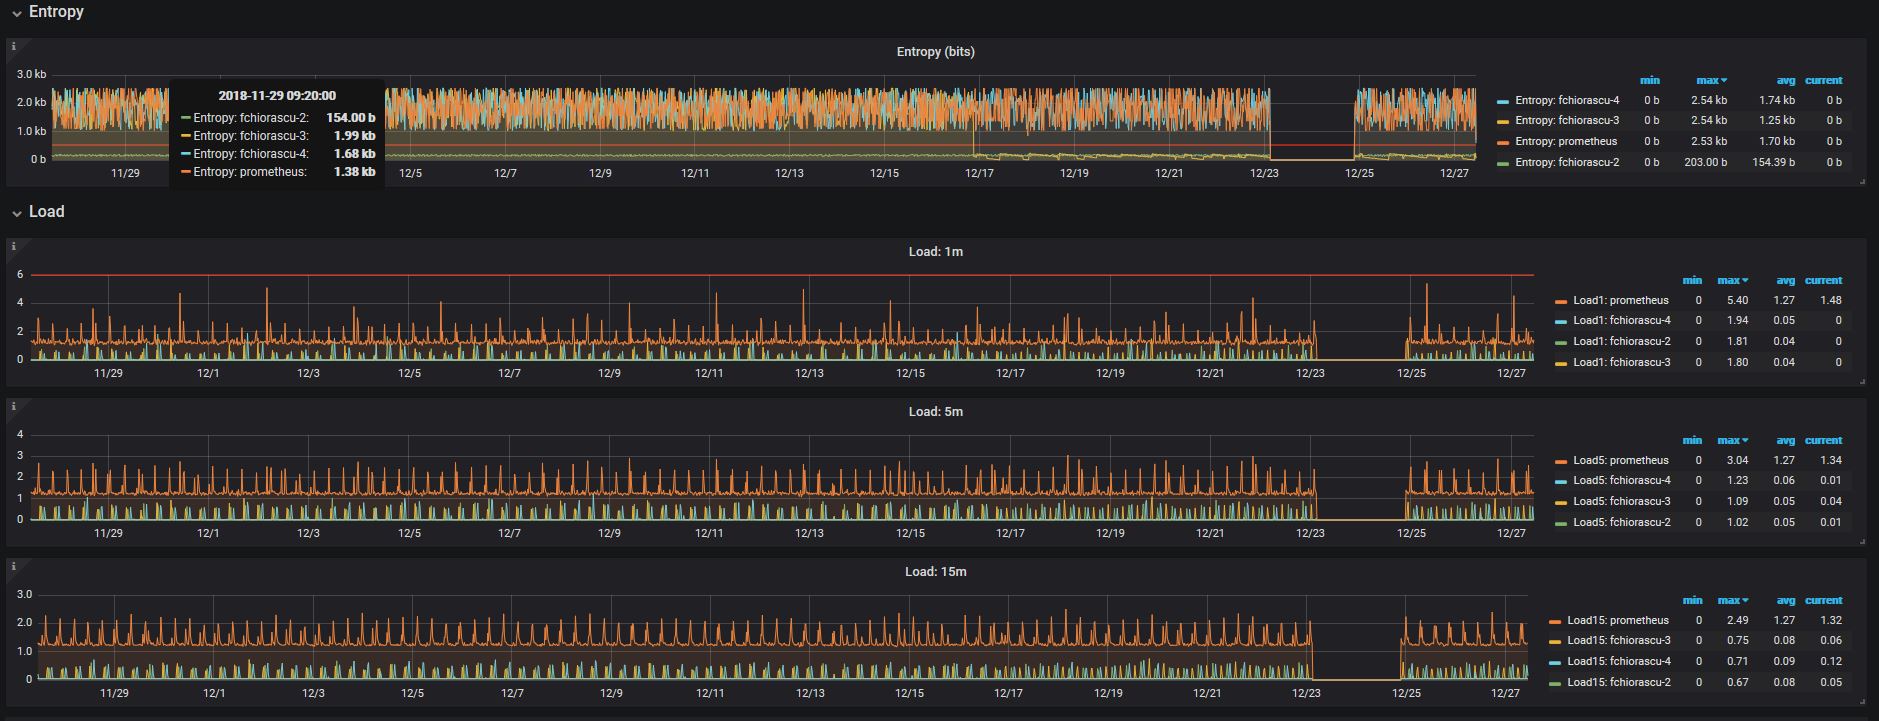
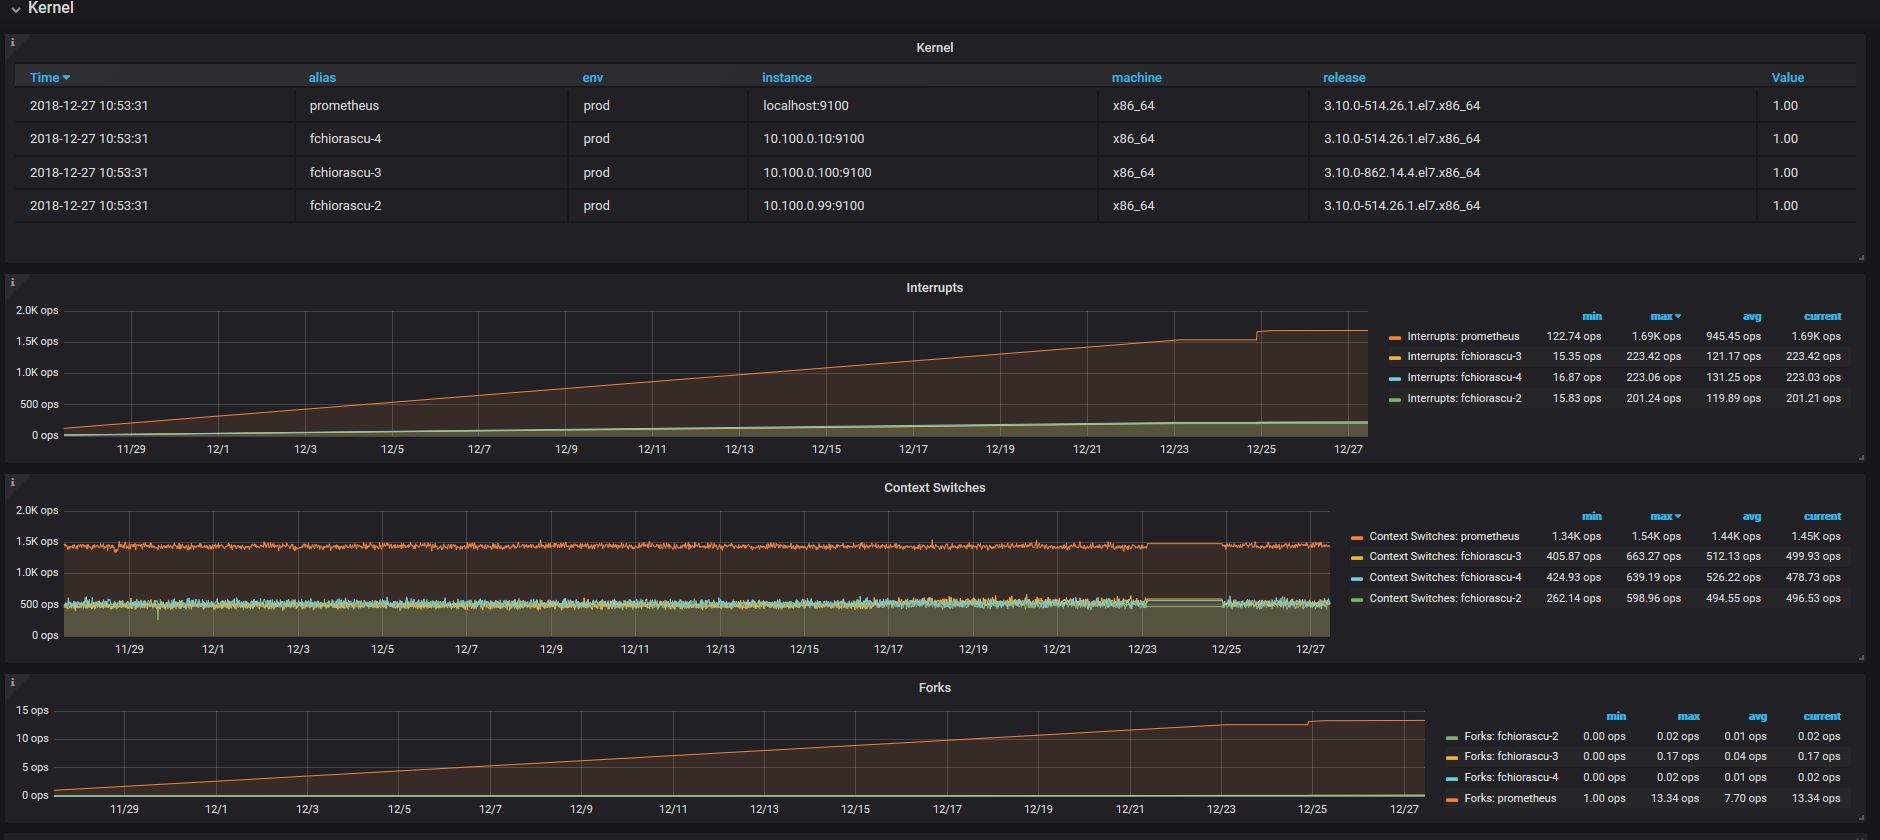
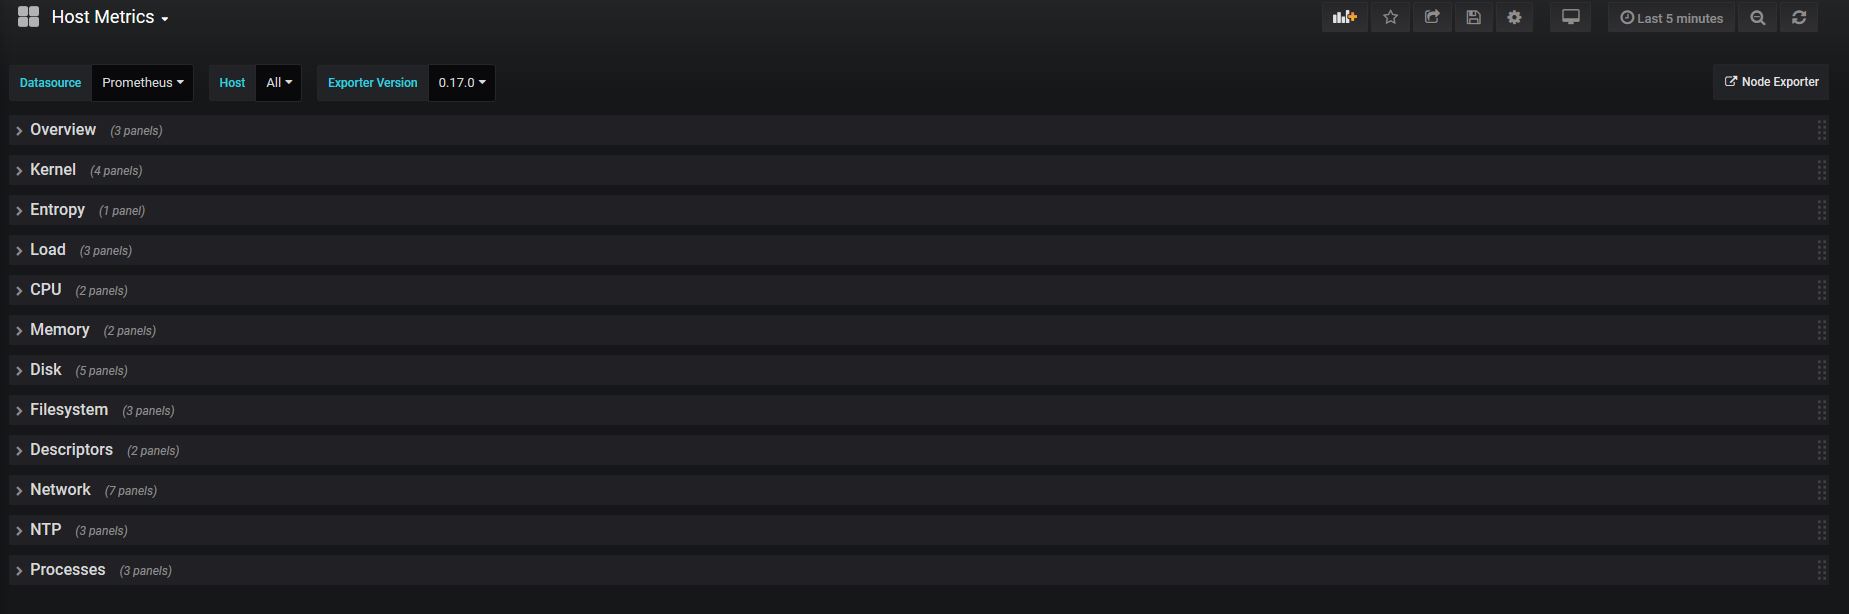
Host Metrics
>=6.7.2
Prometheus
Description
Host Metrics (VM, Server, OS) https://github.com/fchiorascu/Observability
Screenshots
Get Dashboard✕
Download
Copy to Clipboard