1. Kubernetes Deployment Statefulset Daemonset metrics 1,225,6971,225,697 3.8 (13 reviews)
Description
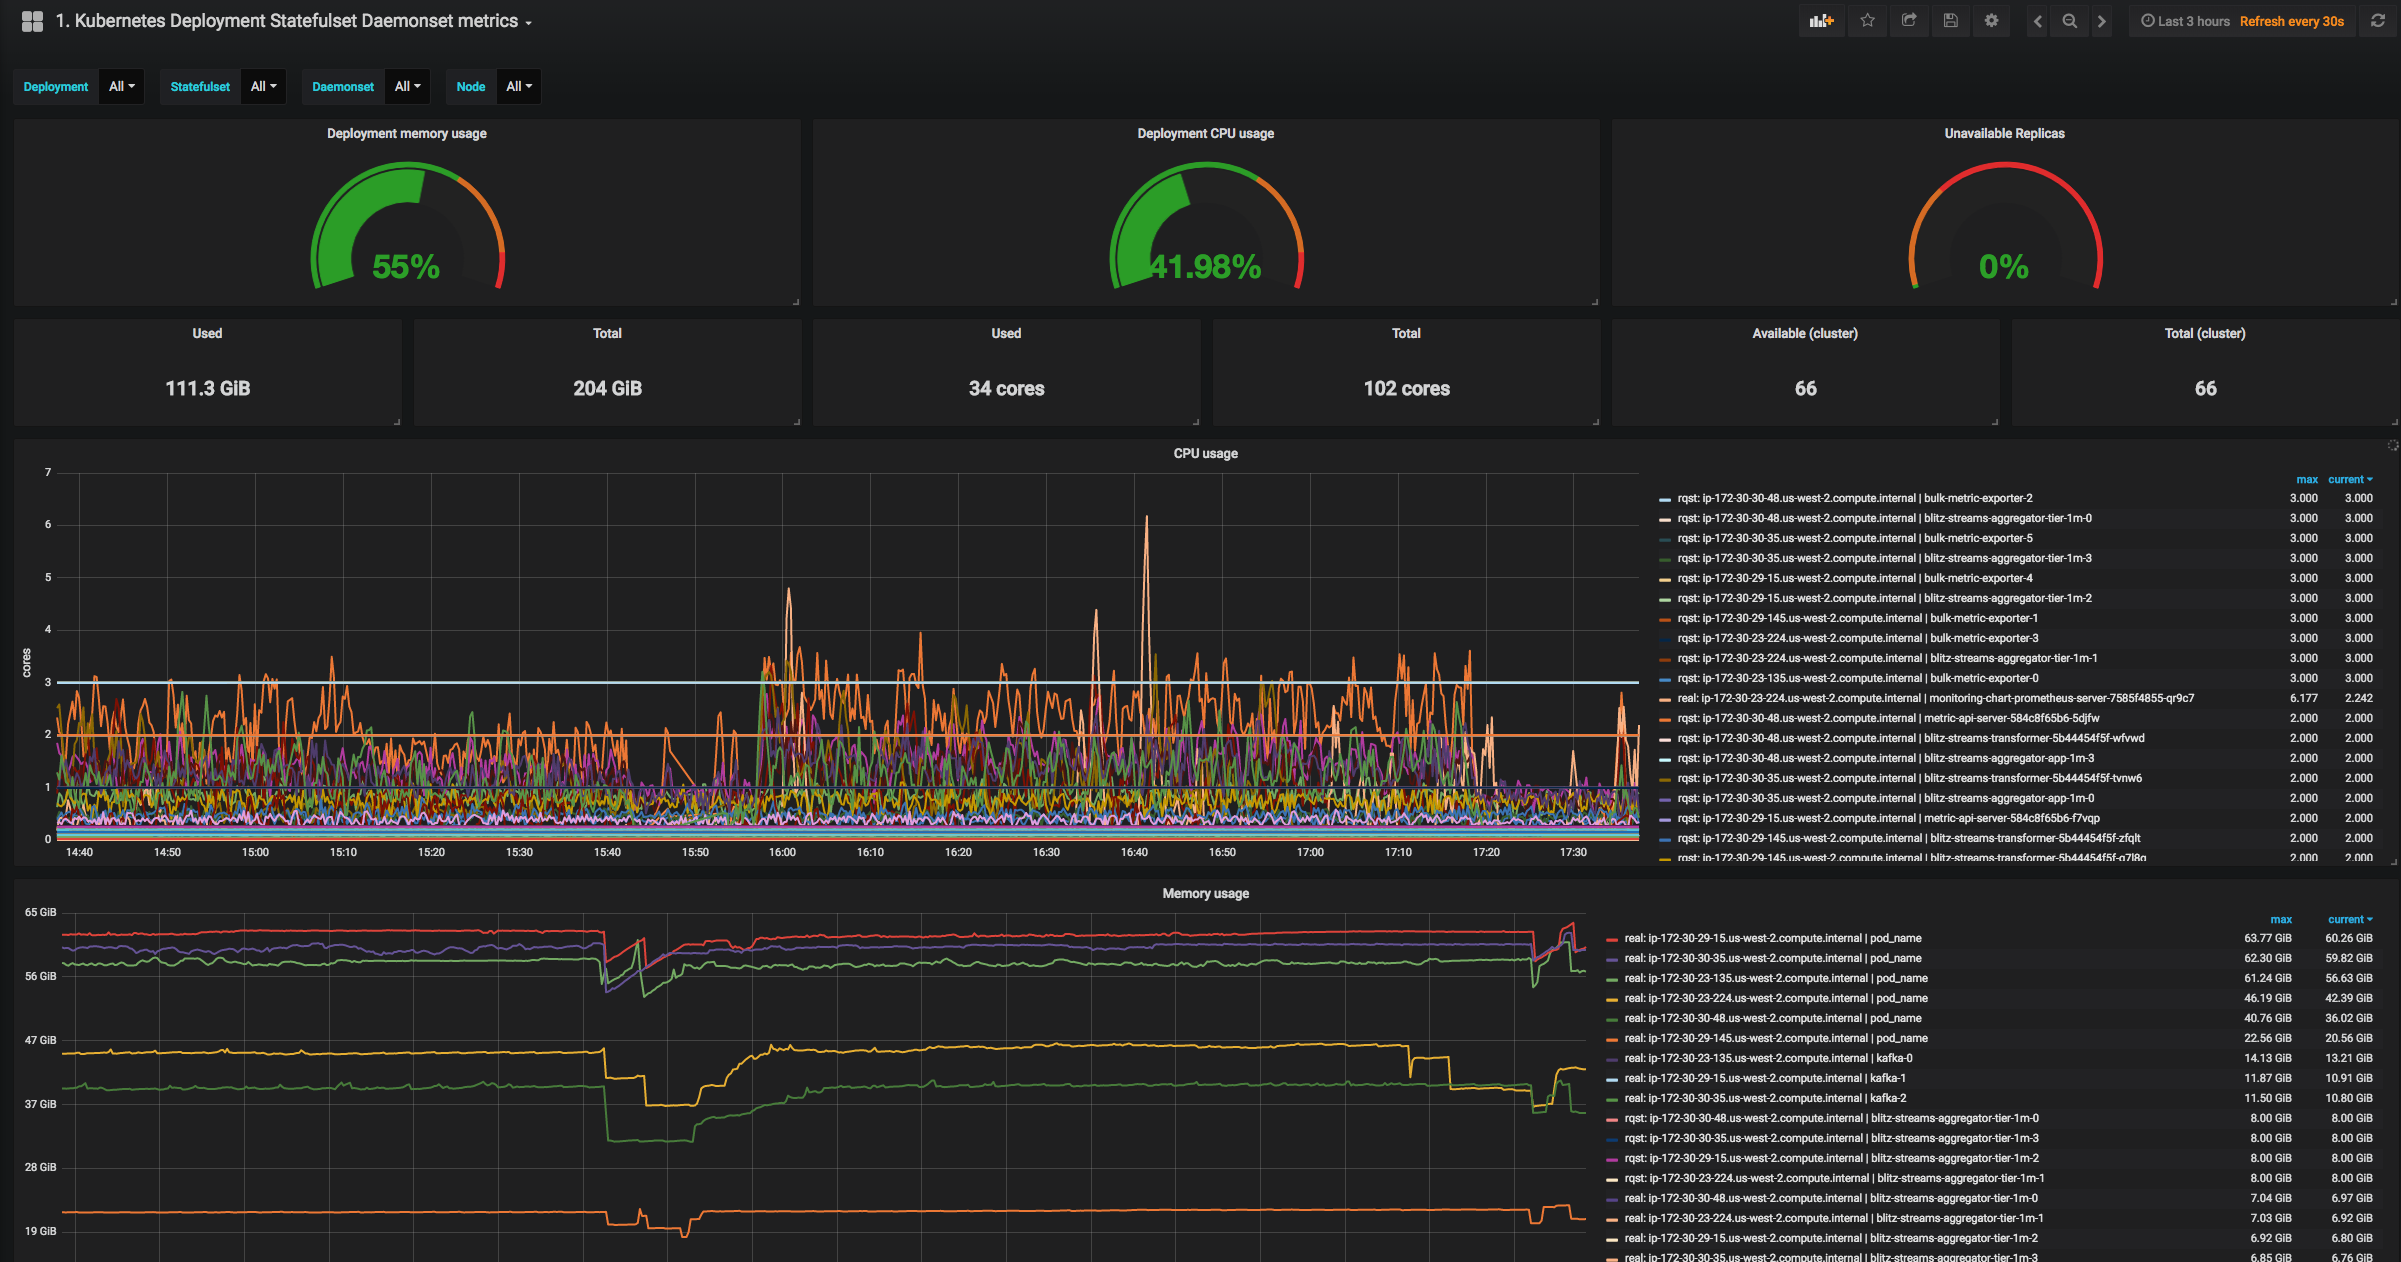
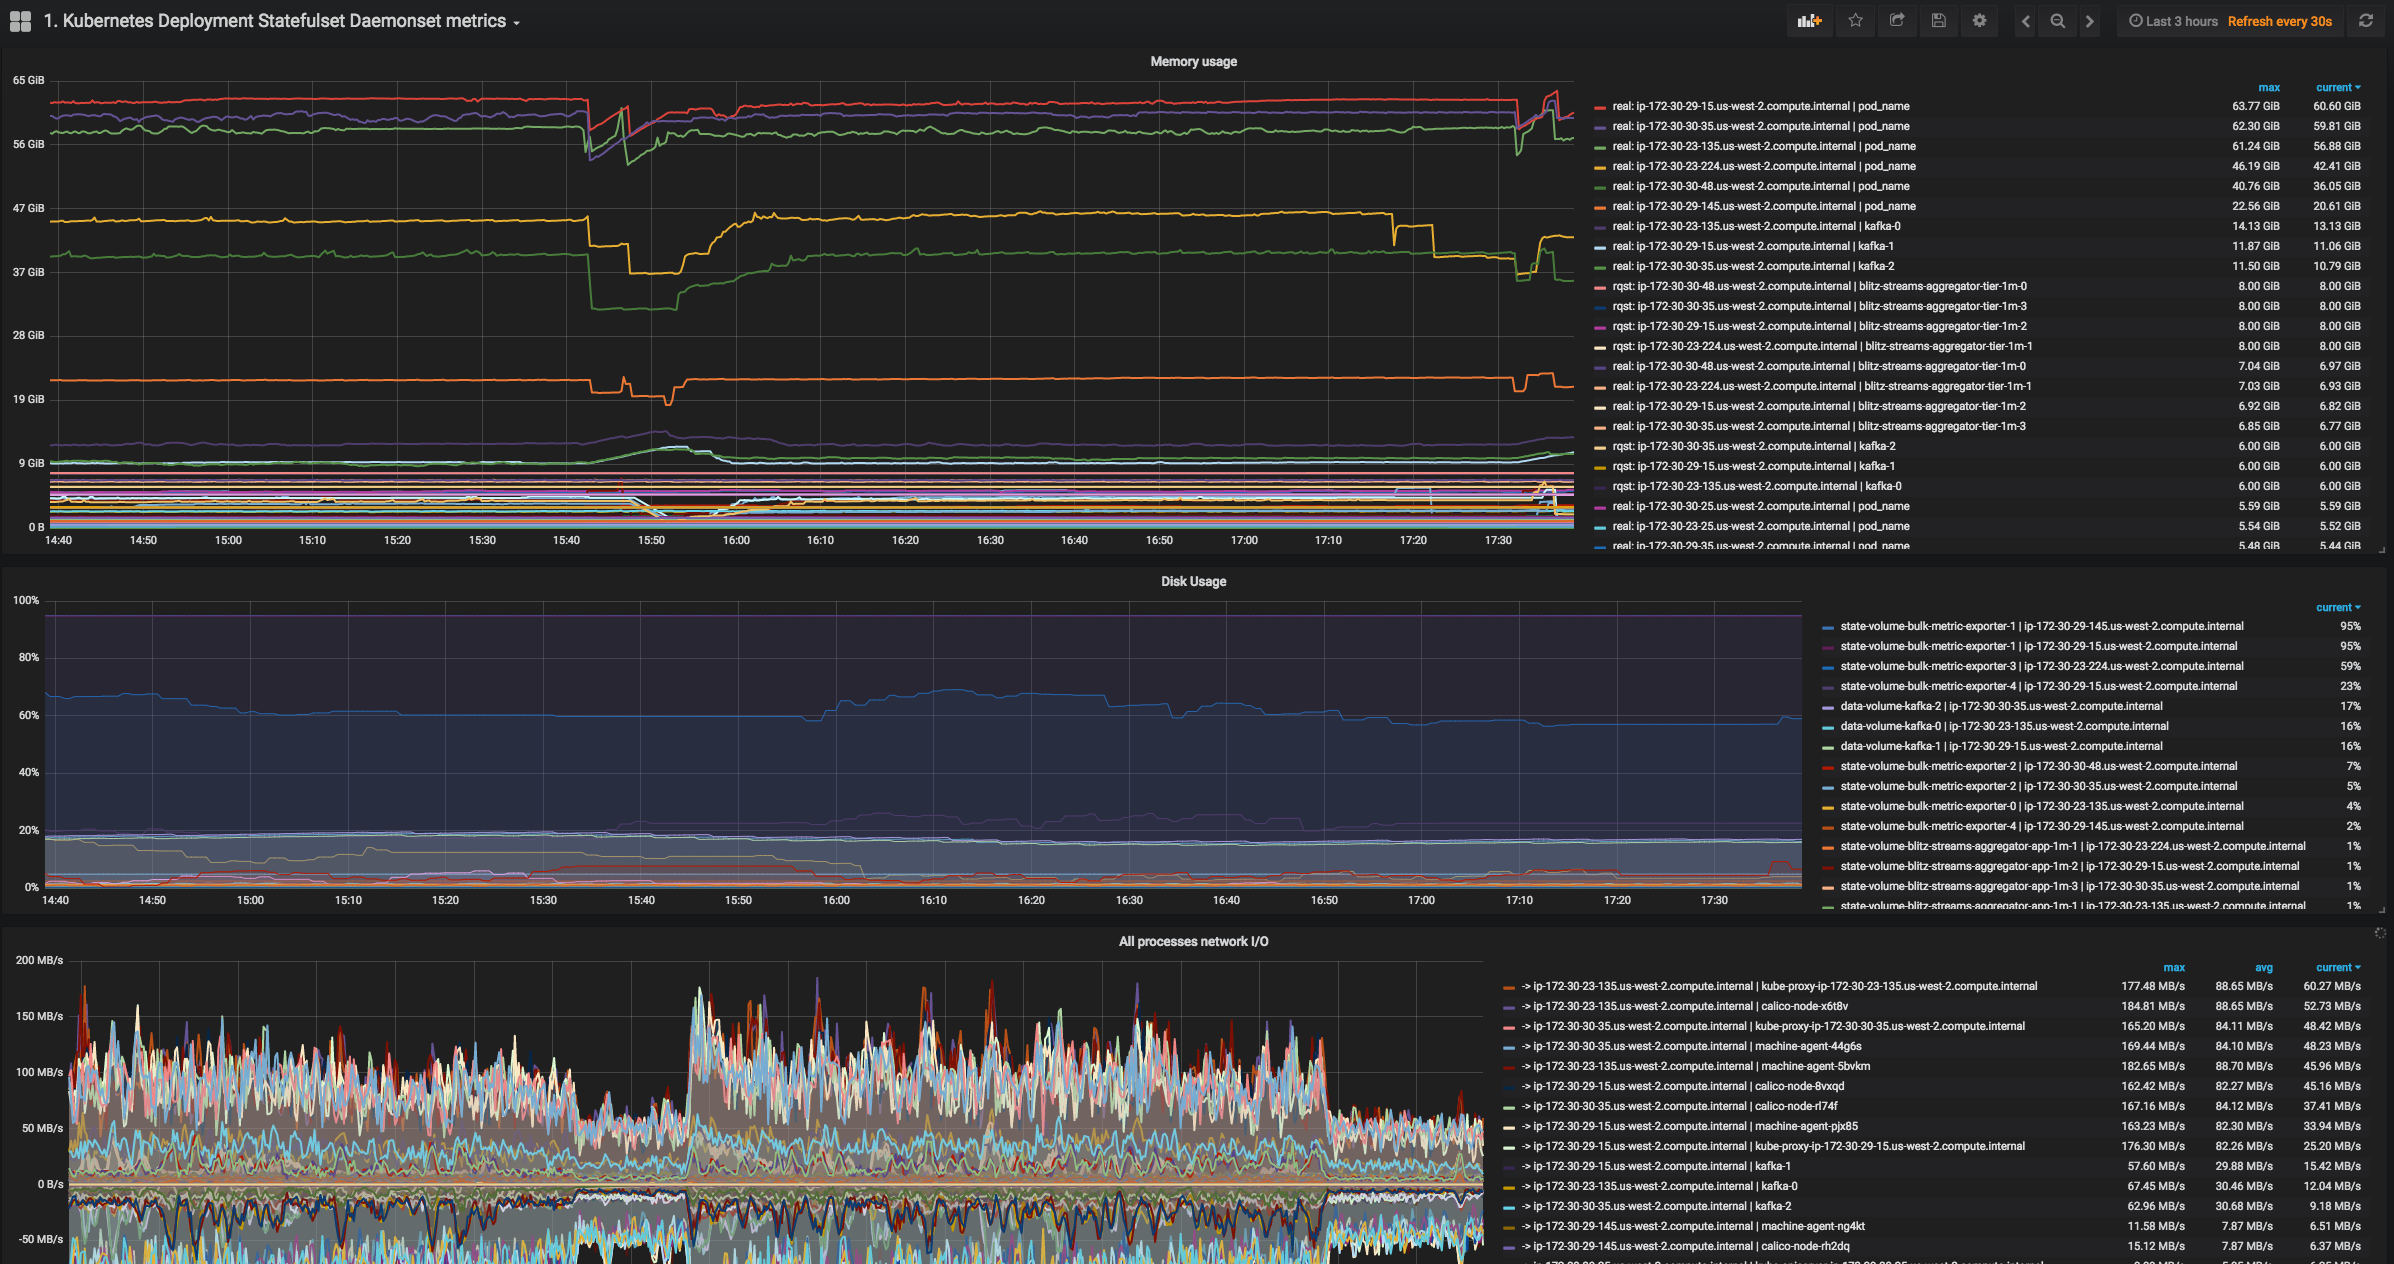
This dashboard monitors Kubernetes workload health and resource usage across Deployments, StatefulSets, and DaemonSets, combining workload replicas and real-time resource metrics. It highlights availability and capacity by tracking metrics such as kube_deployment_status_replicas_available, kube_statefulset_replicas, and kube_daemonset_status_number_ready, while also providing detailed resource utilization with container_memory_working_set_bytes and container_cpu_usage_seconds_total (scaled by machine_cpu_cores for per-node context). Additional panels surface cluster capacity and I/O metrics like memory, CPU, and disk usage, plus network I/O for all processes to surface potential bottlenecks.
Screenshots
Used Metrics 1717
-
container_cpu_usage_seconds_total
-
container_memory_working_set_bytes
-
container_network_receive_bytes_total
-
container_network_transmit_bytes_total
kube_daemonset_status_desired_number_scheduled
kube_daemonset_status_number_ready
kube_deployment_status_replicas
kube_deployment_status_replicas_available
kube_node_status_allocatable_cpu_cores
kube_node_status_allocatable_memory_bytes
kube_pod_container_resource_requests_cpu_cores
kube_pod_container_resource_requests_memory_bytes
kube_statefulset_replicas
kube_statefulset_status_replicas
kubelet_volume_stats_capacity_bytes
kubelet_volume_stats_used_bytes
-
machine_cpu_cores