1 Kubernetes cluster overview(कुबरनेटेस) 114,581114,581 5.0 (3 reviews)
2/26/2020
5/22/2021
5
DockerHost Metrics
>=7.5.5
Prometheus
Description
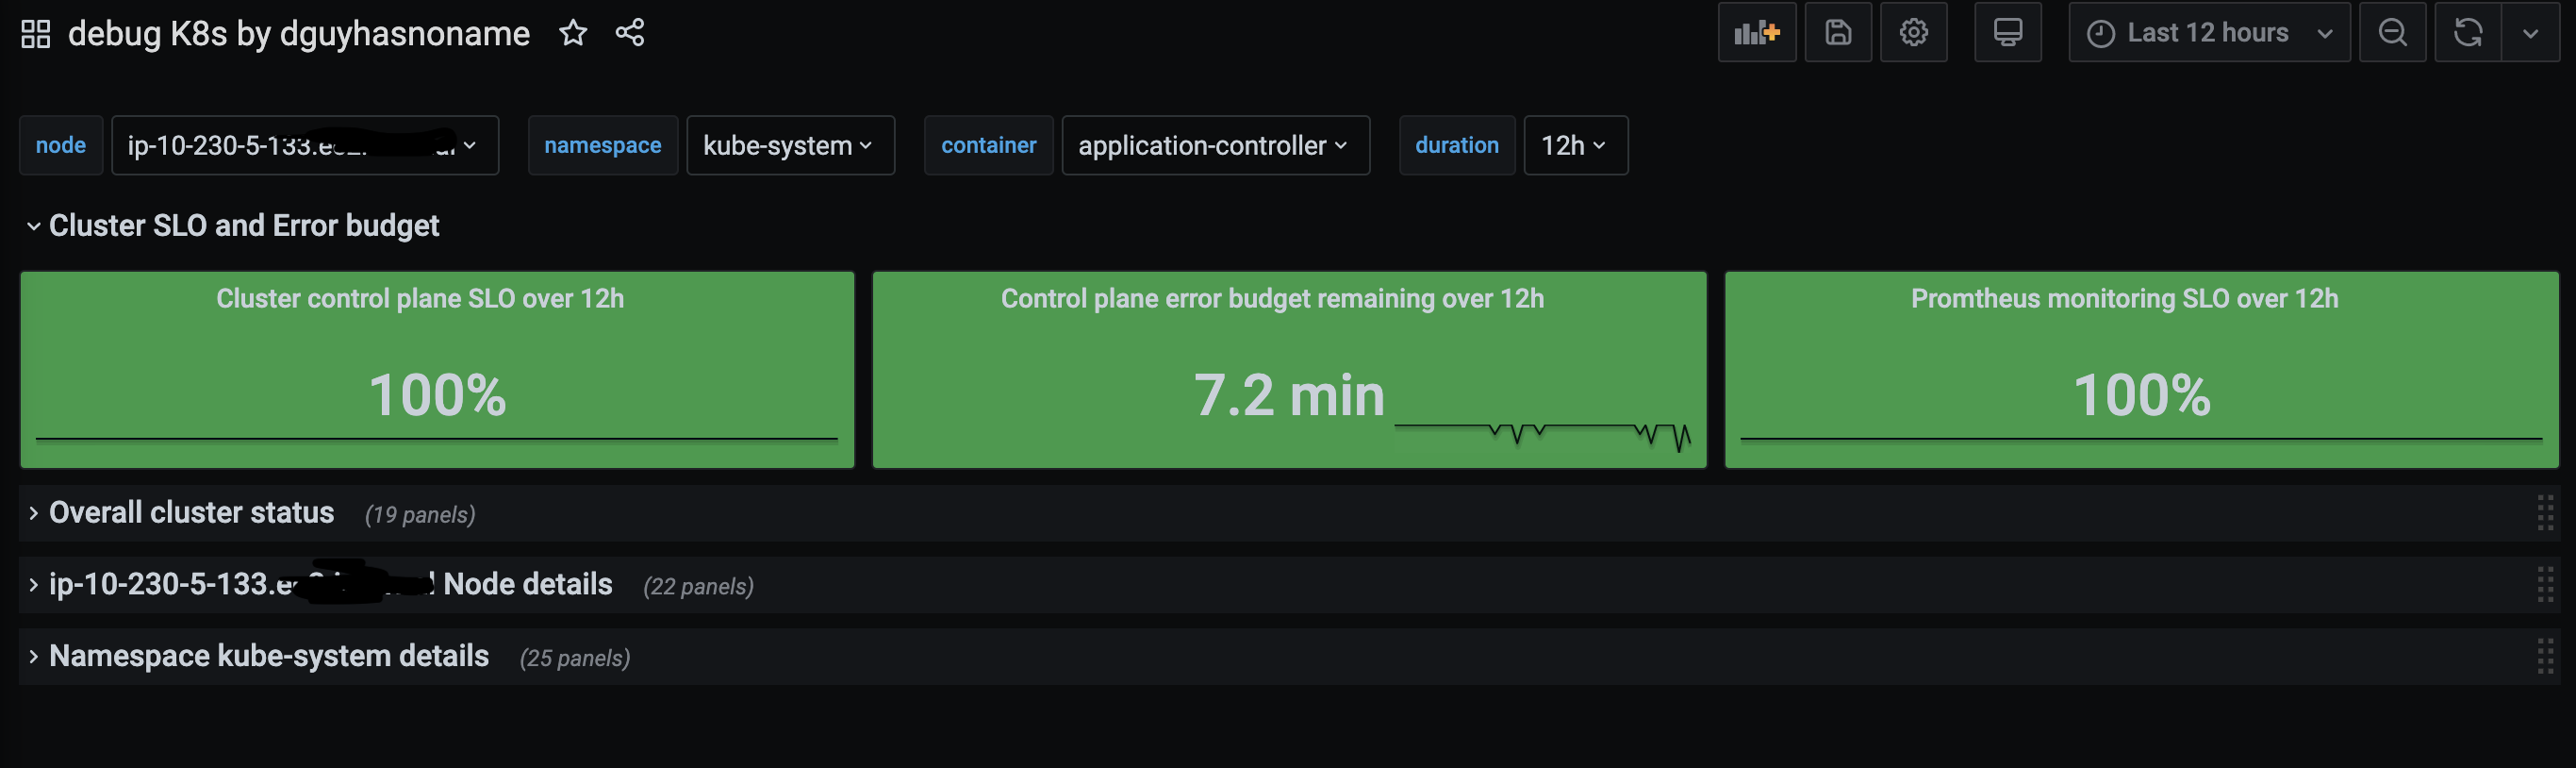
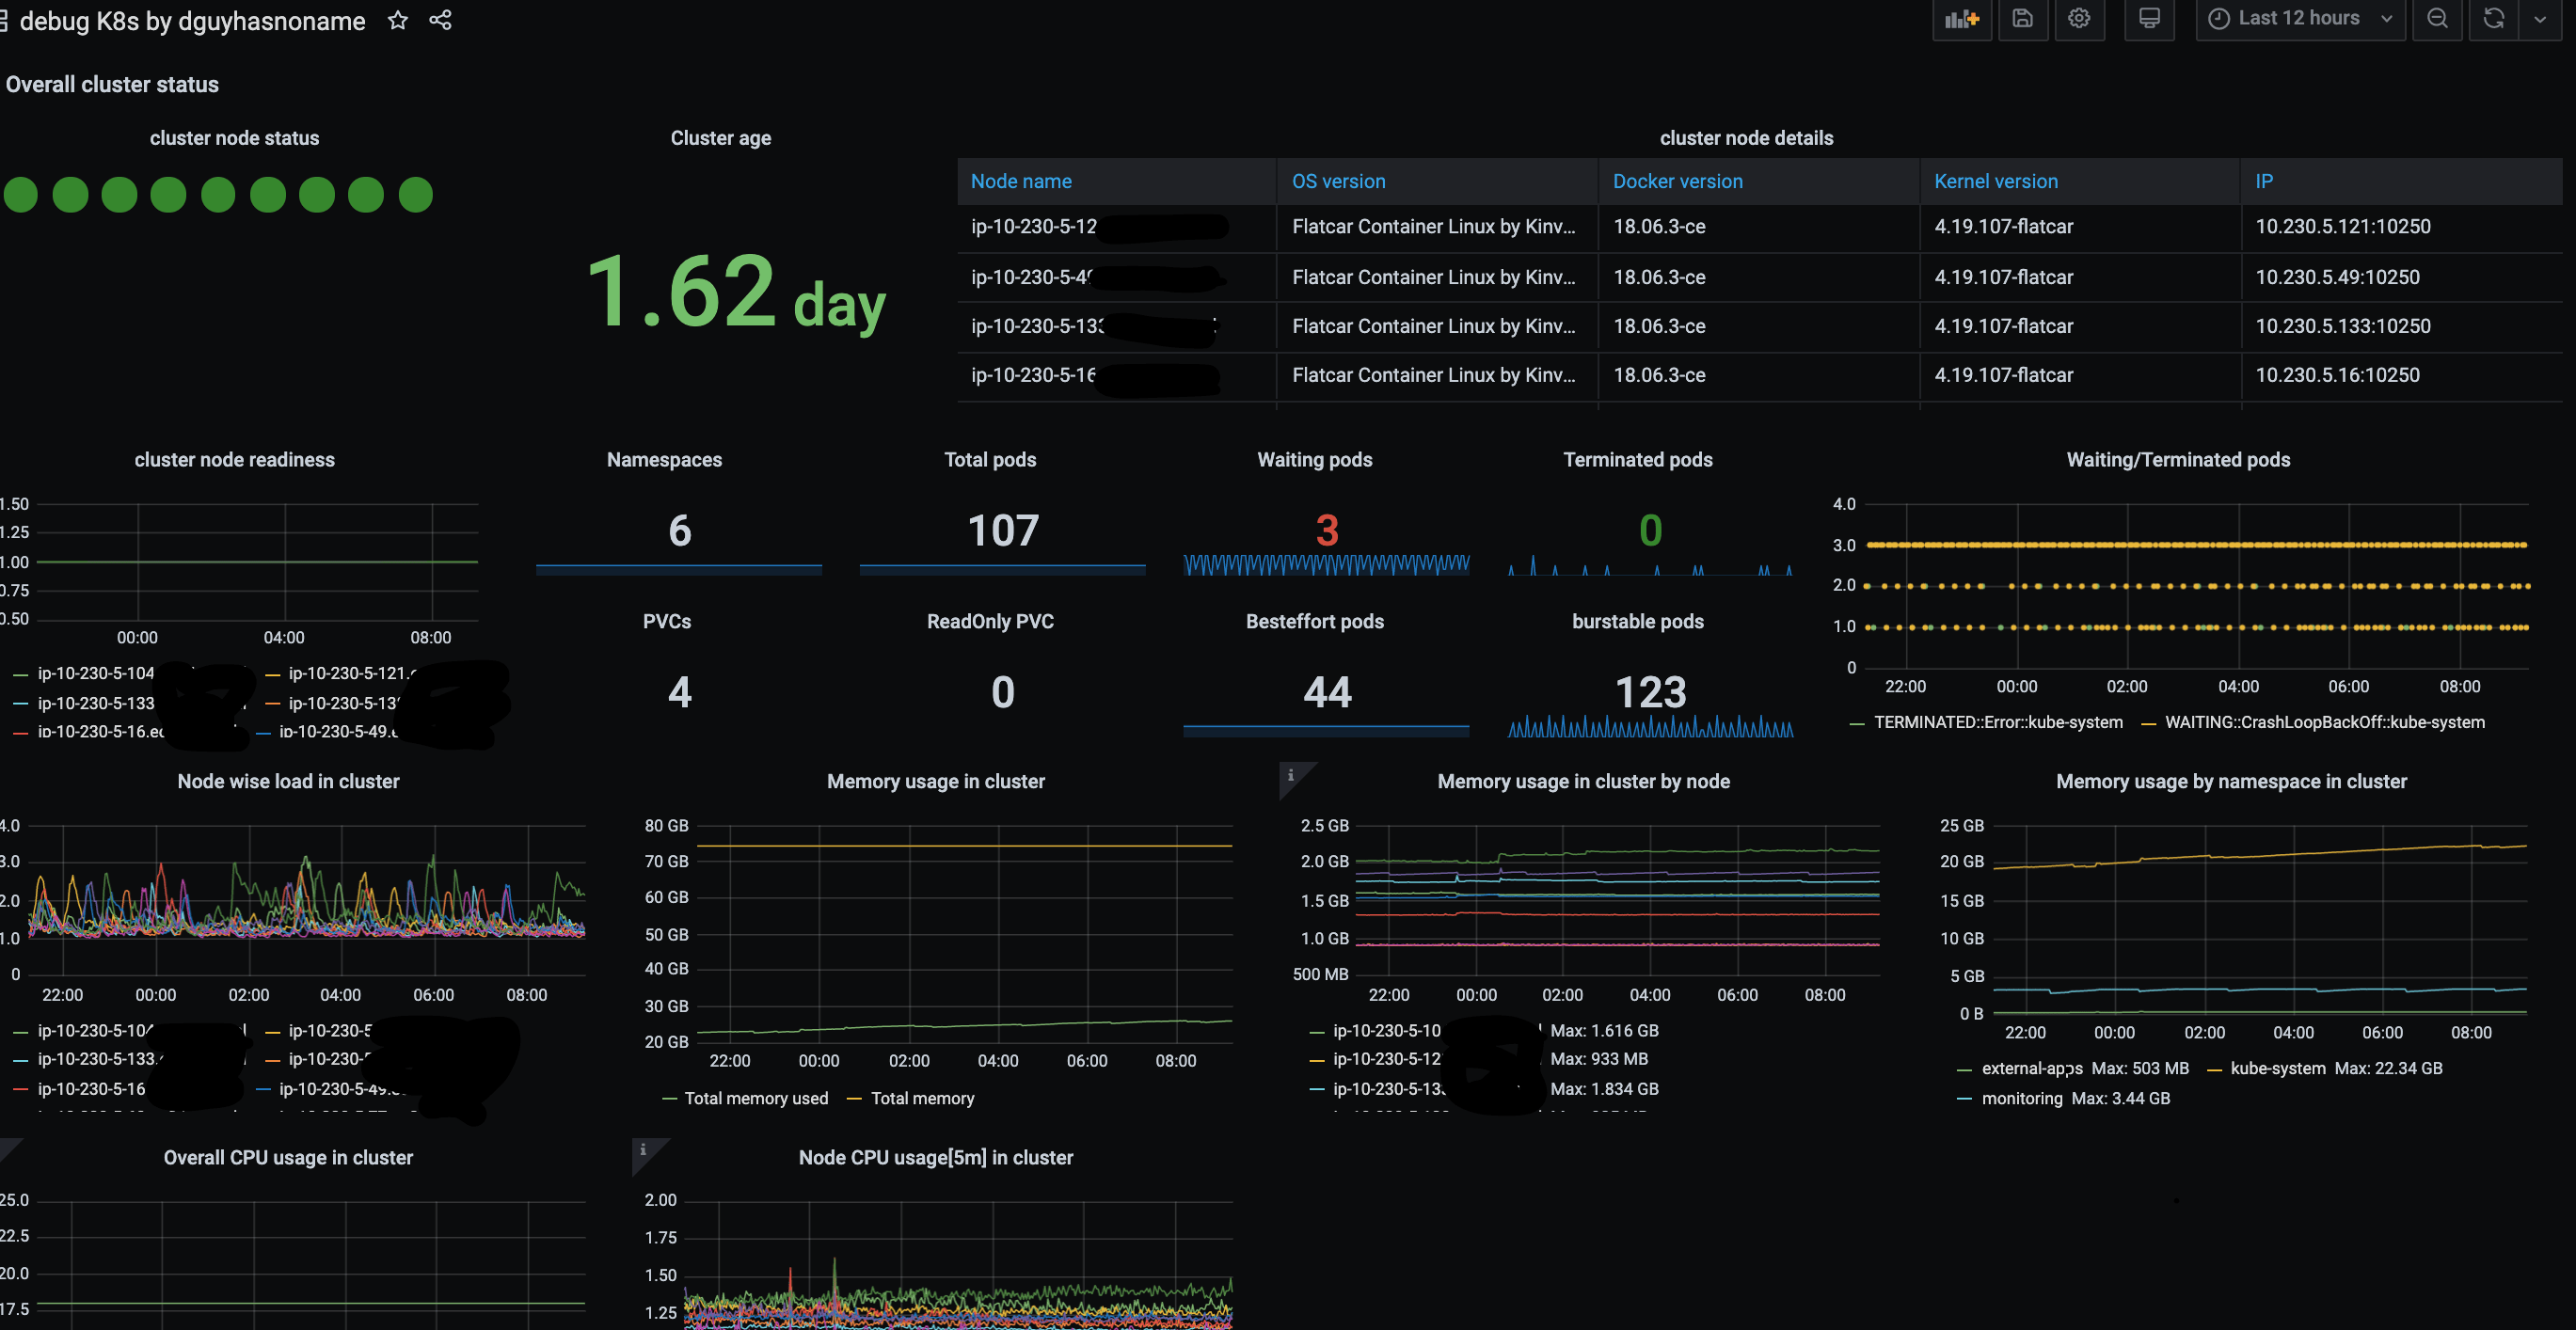
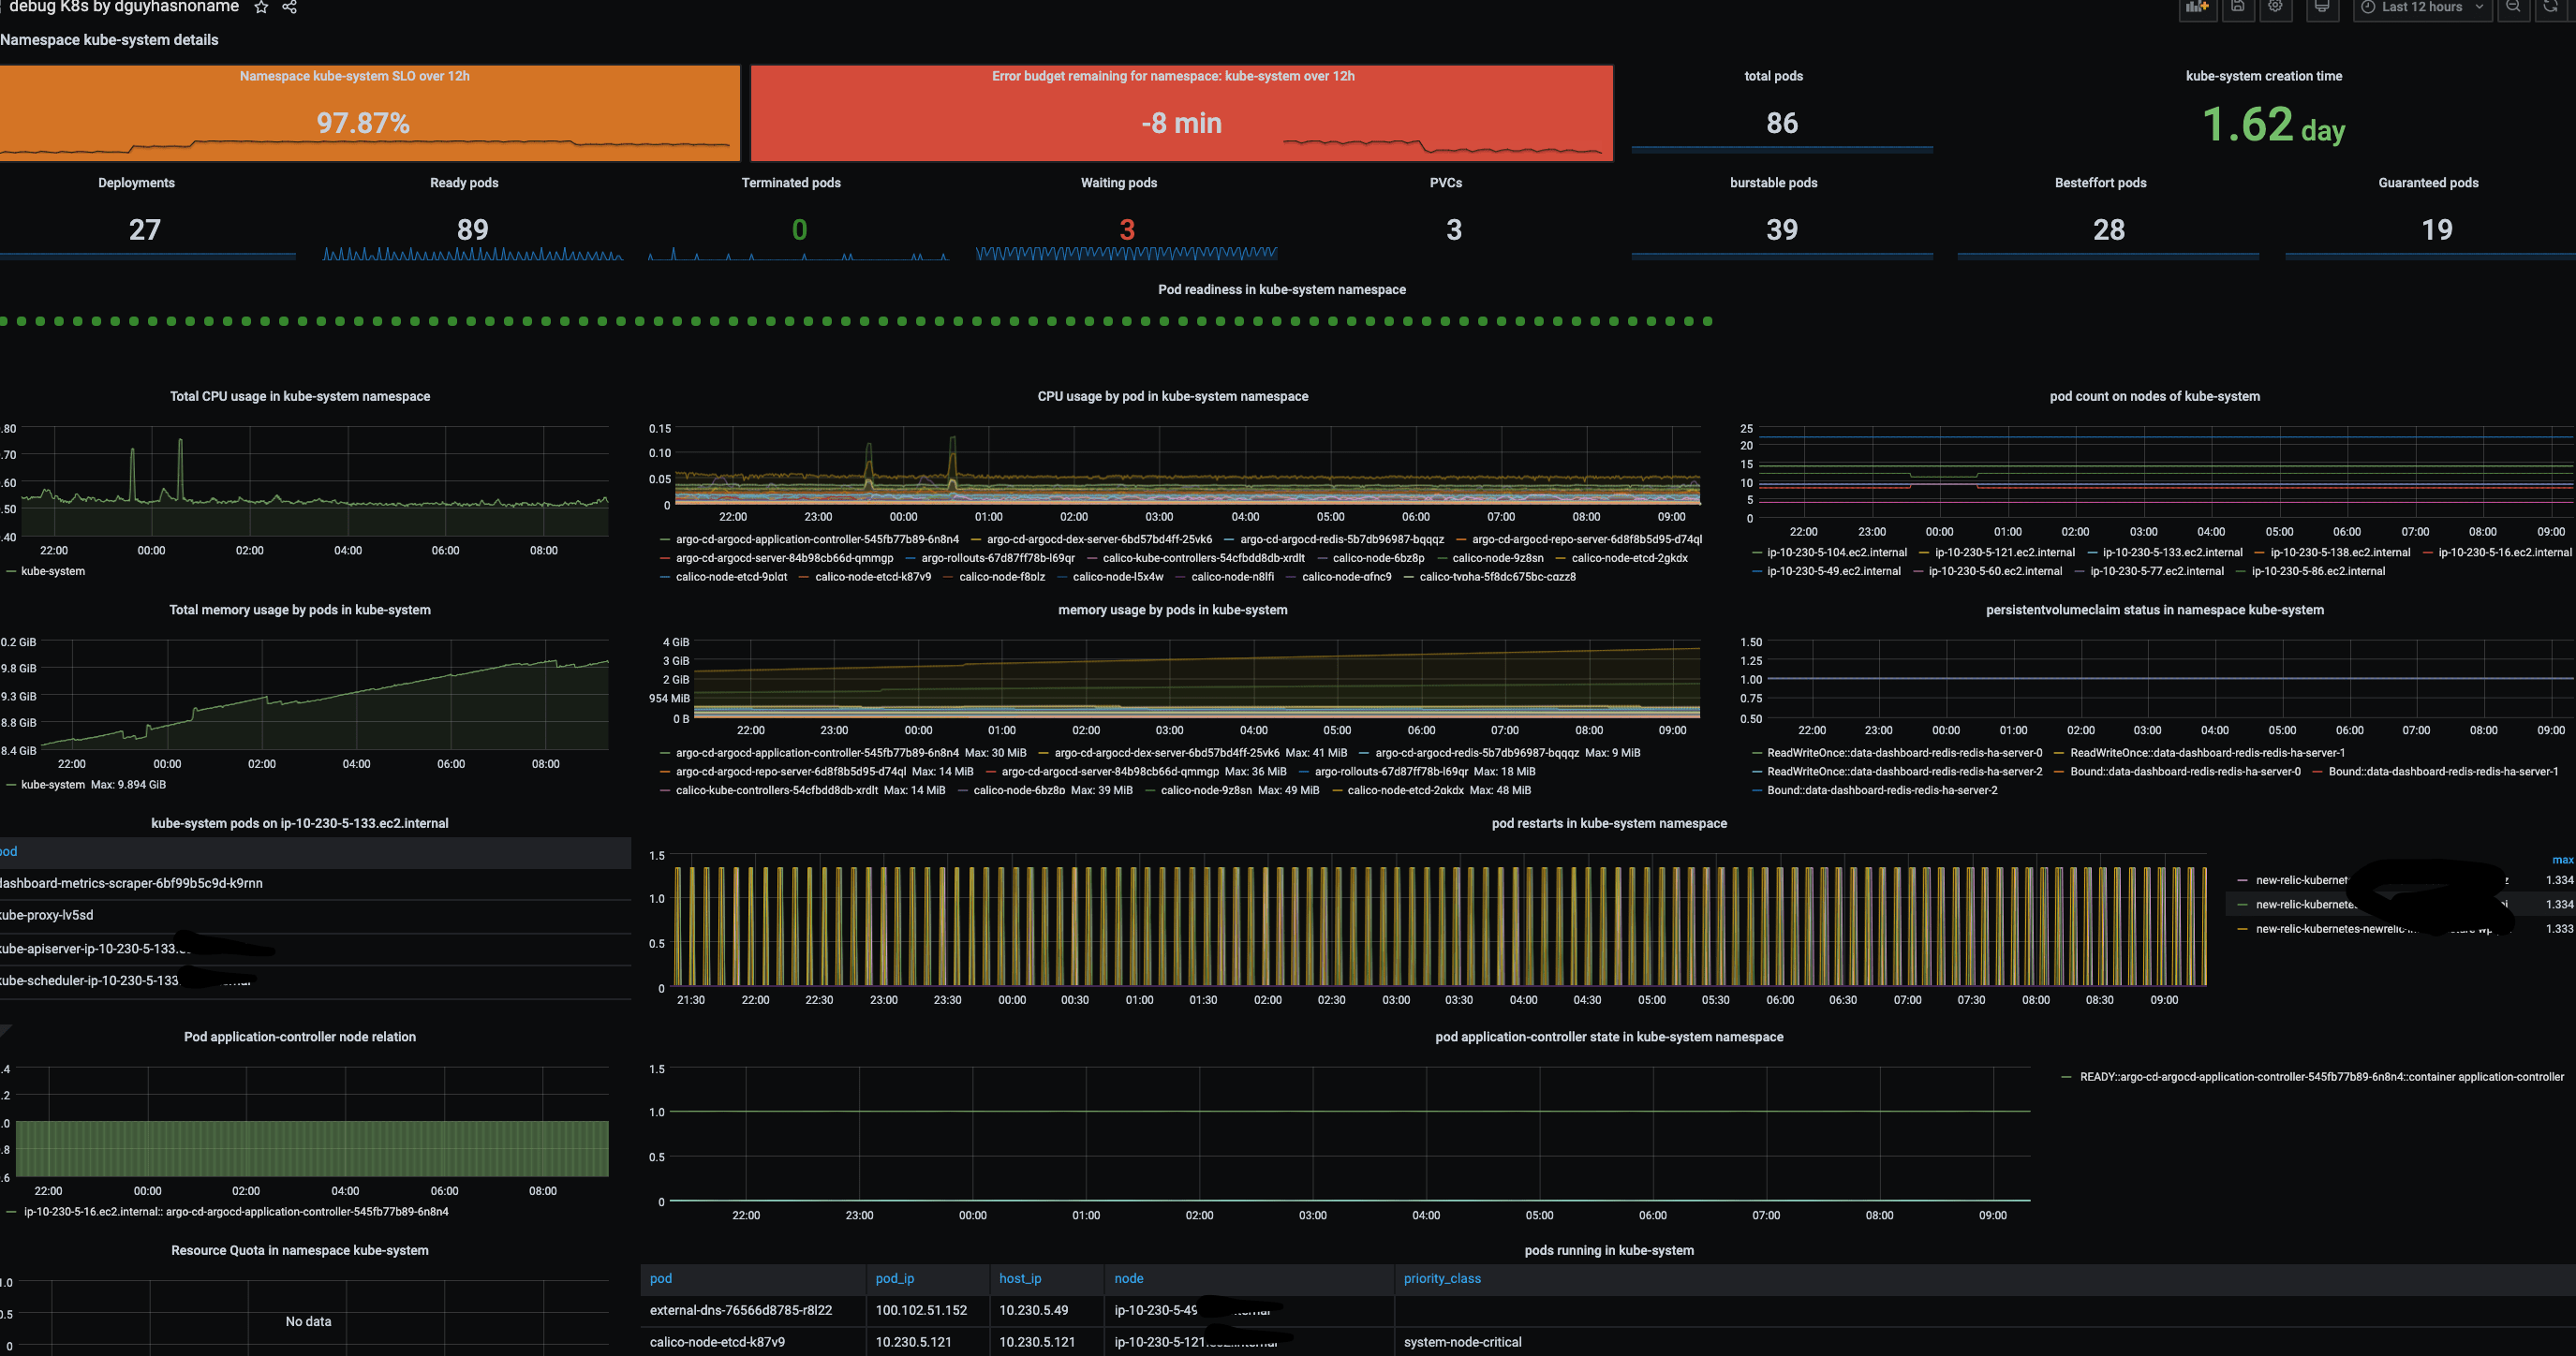
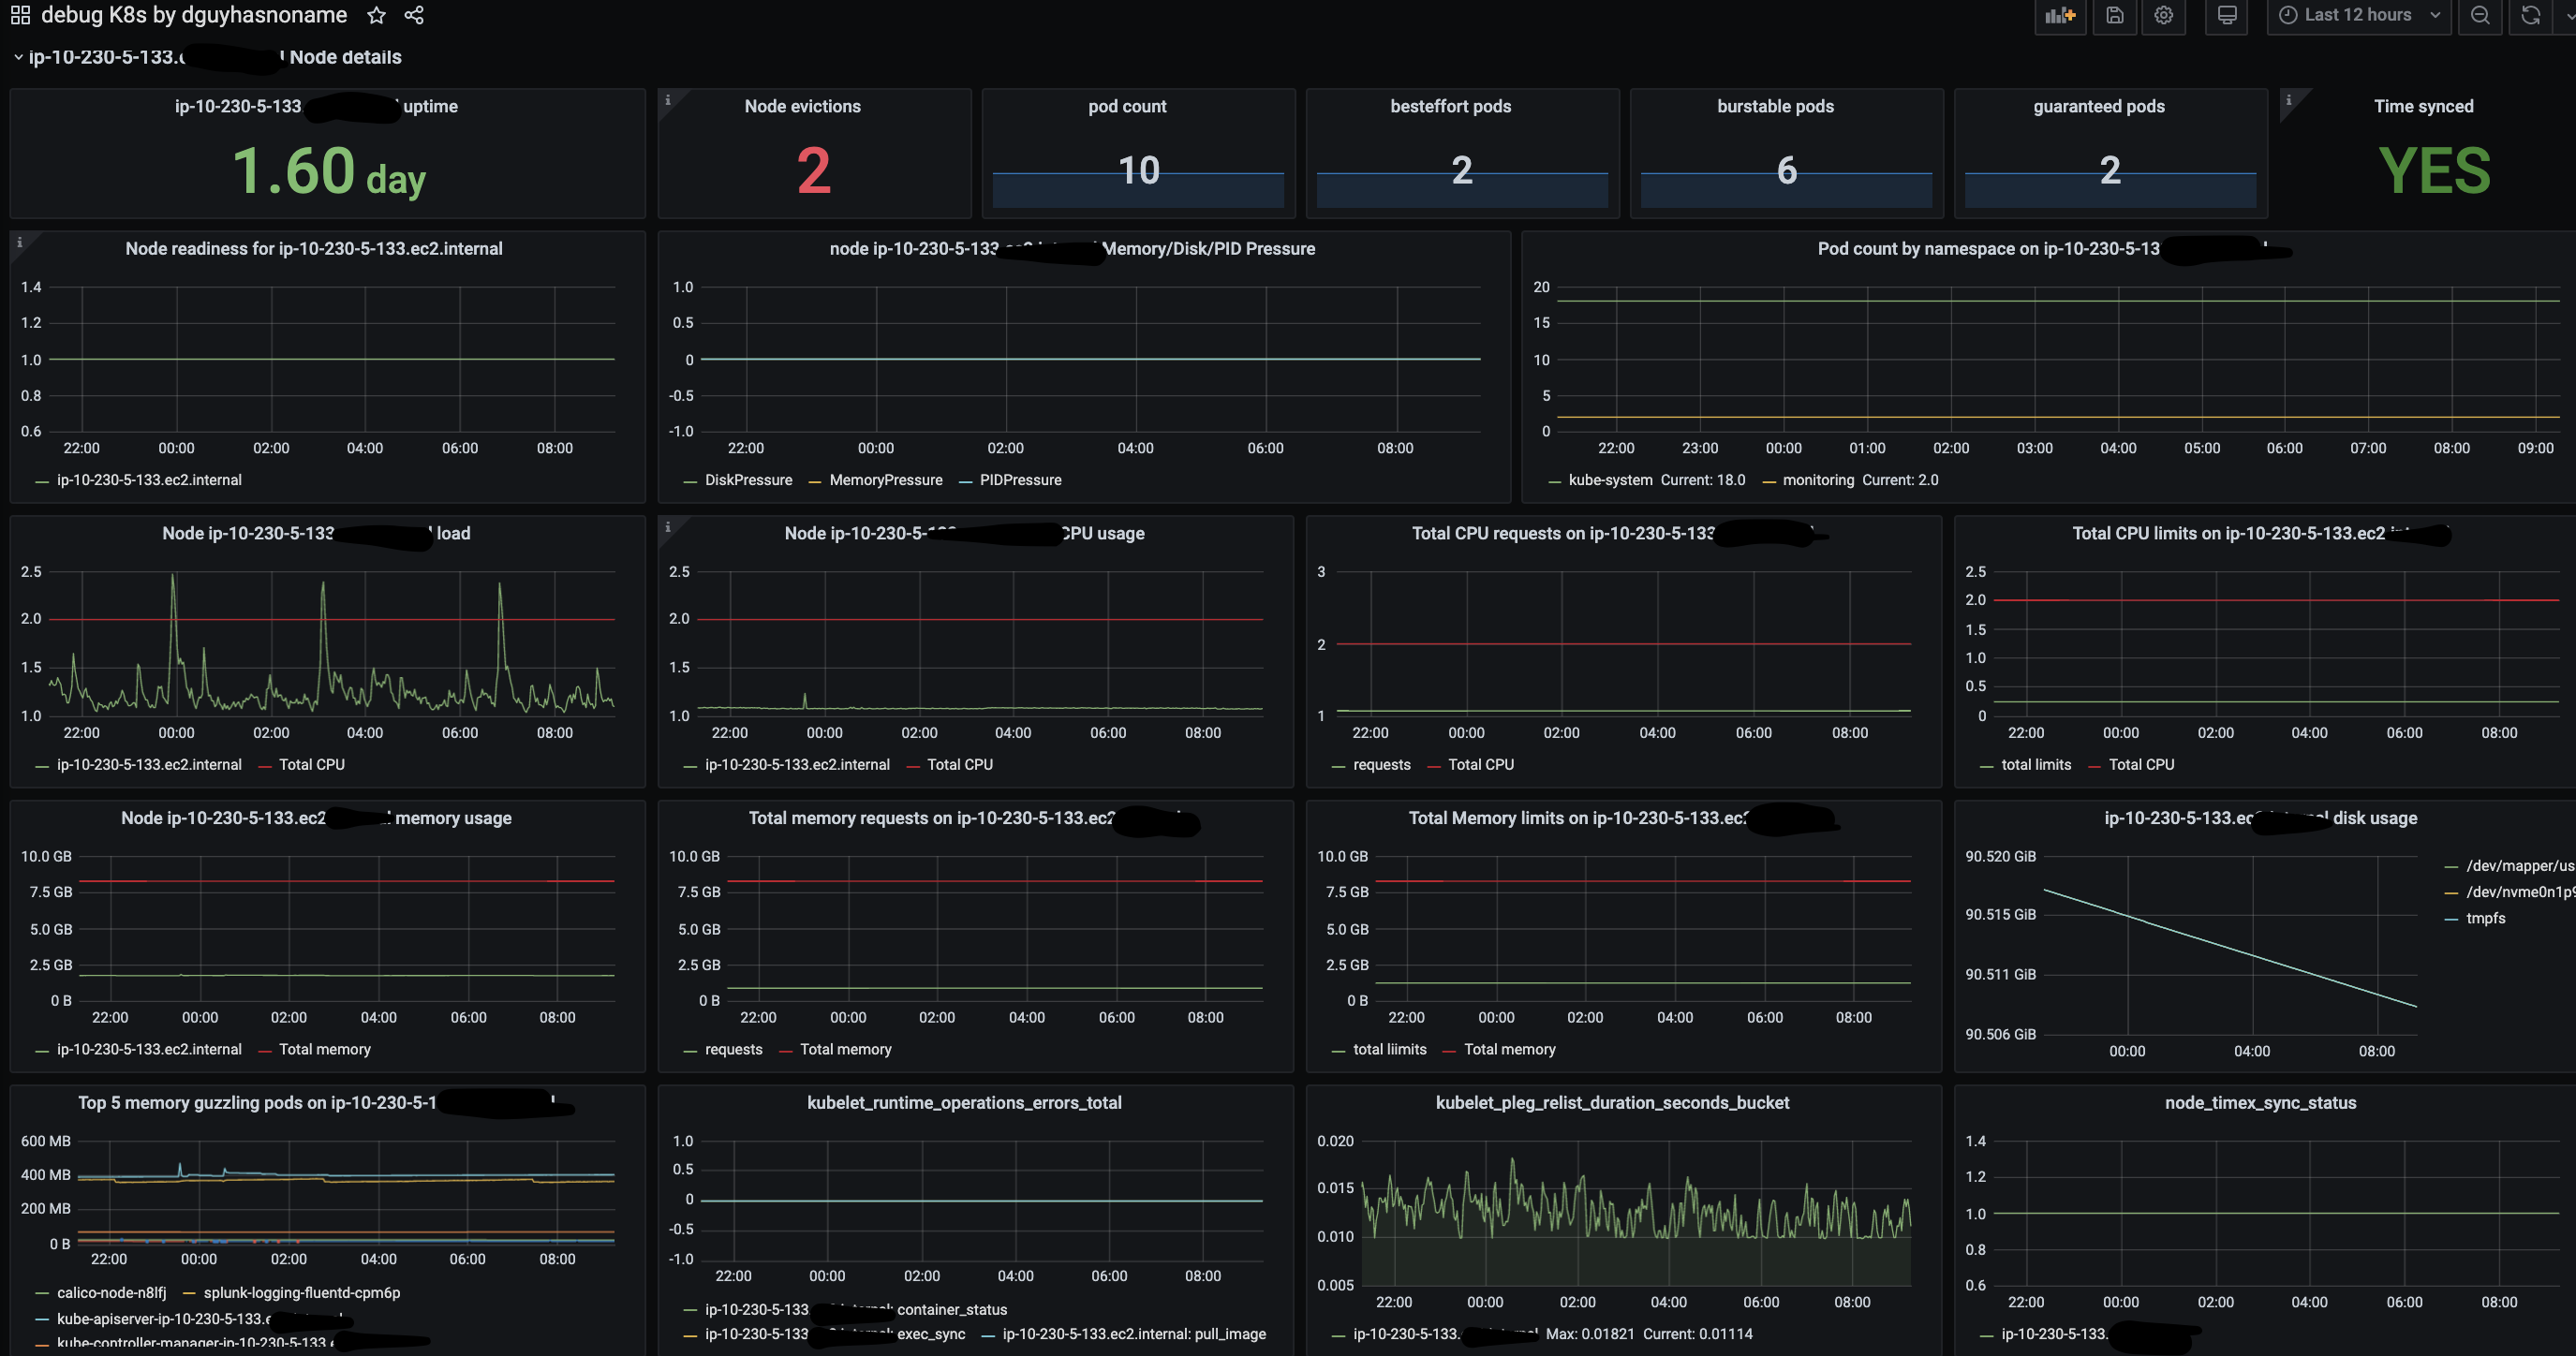
Monitors a single Kubernetes cluster by presenting essential health and capacity metrics across core components. It highlights node/resource utilization, pod status and availability, and control plane health to detect scheduling issues, resource bottlenecks, and potential failures. Key metrics likely include node_cpu_seconds_total, container_memory_usage_bytes, and kube_pod_status_phase to provide actionable insights at a glance.
Screenshots
Get Dashboard✕
Download
Copy to Clipboard