1.12 DC/OS Alert Center Dashboard 1,2451,245 3.0 (2 reviews)
11/14/2018
11/14/2018
1
>=5.1.3
Prometheus
Description
Example of an Alert Center for DC/OS 1.12
Screenshots
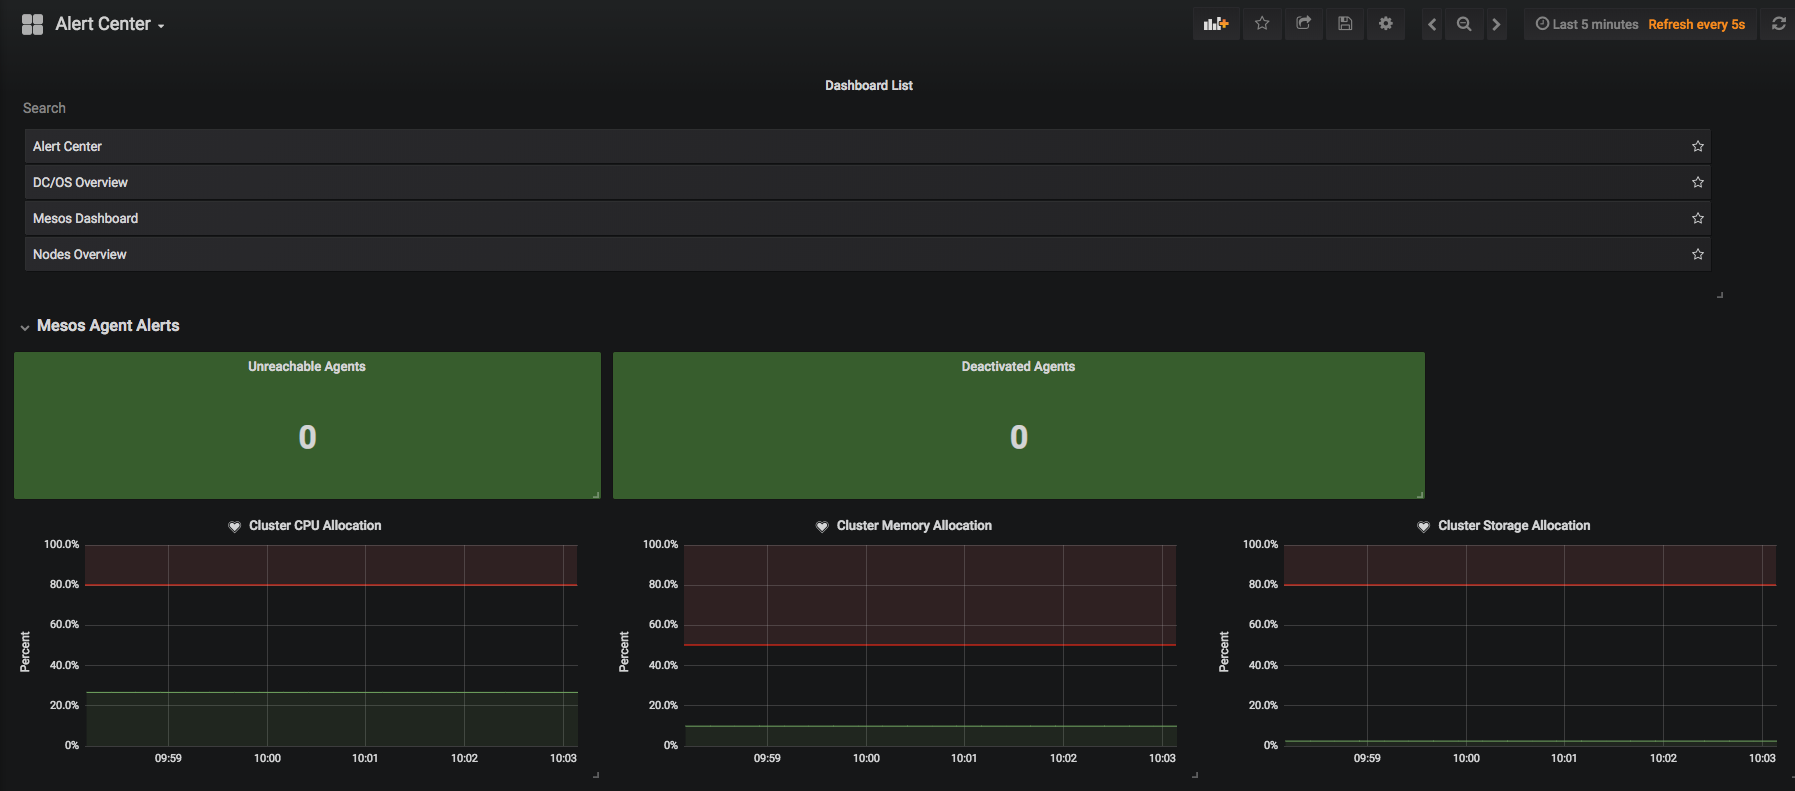
Used Metrics 1313
cpu_usage_guest
cpu_usage_system
cpu_usage_user
mem_active
mesos_master_cpus_percent
mesos_master_disk_percent
mesos_master_frameworks_inactive
mesos_master_mem_percent
mesos_master_slaves_inactive
mesos_master_slaves_unreachable
mesos_master_tasks_failed
mesos_master_tasks_lost
mesos_master_tasks_unreachable
Get Dashboard✕
Download
Copy to Clipboard